
Michael Heath & Michael Brown
University of Strathclyde’s marine modelling group recently hosted two MEESO project researchers; Berthe Vastenhoud and Amanda Schadeberg on internships from the Danish Technical University and Wageningen University & Research respectively. Berthe is completing her PhD on mesopelagic fish and wanted to work with MEESO modellers Douglas Speirs and Emma Dolmaire on using estimates of spatial distributions and growth rates from survey data with population models. Amanda’s PhD work in mesopelagic fishing governance includes studying the cultural interactions between science disciplines (we were her observational subjects!).
We were poring over mesopelagic fish length distribution data from trawl surveys carried out during MEESO trying to identify annual cohorts of fish in order to estimate their growth trajectories. Then we remembered a set of surveys from 2001/2002 carried out in the Irminger Sea by the research ship Discovery during the UK Natural Environment Research Council’s “Marine Productivity” (MarProd) Programme. This involved 4 surveys, in November/December 2001, April/May 2002, August 2002 and November/December 2002 (FIGURE 1).
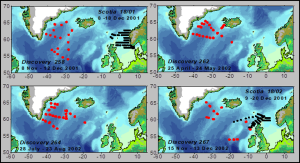
FIGURE 1. Maps showing the sampling locations (in red) during the four Marine Productivity surveys by the research vessel Discovery during 2001/2002. Additional sampling was carried out by the research vessel Scotia (in black)
The main focus of MarProd the was the population dynamics of the copepod Calanus finmarchicus (see Heath et al. 2008), but the sampling also included 2.25 m2 mid-water frame trawl tows for predators on Calanus. So, what data might there be on mesopelagic fish? The data were available from the British Oceanographic Data Centre (https://www.bodc.ac.uk/resources/inventories/edmed/report/222/).
We discovered some potentially valuable data for both MEESO and SUMMER. Mesopelagic fish in the frame trawl samples were only identified to coarse groups not species, but the main group represented Benthosema glaciale and Maurolicus muelleri. Composite length distributions for each survey showed progression of annual cohorts though the length distributions (FIGURE 2), allowing Berthe to obtain a new estimate of mesopelagic fish growth rates in the Irminger Sea, which was a great outcome.
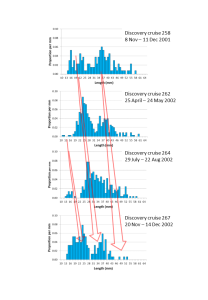
FIGURE 2. Combined Benthosema glaciale and Maurolicus muelleri length distributions (1mm length classes) aggregated over each of the four Discovery surveys in 2001 and 2002. At least three annual cohorts of fish can be identified in the data. The red arrows approximately show their growth trajectories over time.
However, for us in SUMMER there was the added benefit of discovering data on the vertical distributions of these fish, which will be invaluable for validating the game theory model of mesopelagic community diel (day-night) vertical migrations that we are developing in WP3. The model is an extension of a model described in a recent paper by Jérôme Pinti and co-authors (Pinti et al. 2003).
The frame-trawl samples were collected from two depth layers (surface – 400m and 400 - 800m) at each site (FIGURE 3). The expectation based on “accepted wisdom” was that the data would show fish concentrated between 400 and 800m during daylight, and migrating into the shallower 0-400m layer at night. However, at 60°-63°N there is a large difference in daylength between winter and summer (7h vs 17h). So how might the vertical behaviour respond?
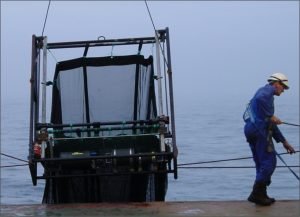
FIGURE 3. Image of the 2.25 m2 frame trawl used on the Discovery surveys (Image: Alex Mustard).
Data were sparse from the two winter surveys due to extremely challenging weather conditions, but showed no clear aggregation in the shallow layers during the night-time. In the spring (April/May) survey the fish were always concentrated at depth during the day, and less so during the night. However in the autumn survey (August) there was a clear day-night difference in distribution consistent with the expectations (FIGURE 4).
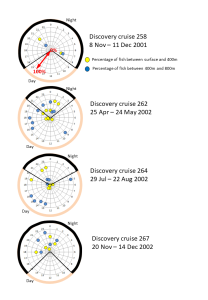
FIGURE 4. Composite data for each survey on the daily vertical distribution patters of the combined Benthosema glaciale and Maurolicus muelleri mesopelagic fish species. Numbers around the periphery of each plot show the time of day (local) at which tows were carried out (local time = UTC – 2.5 hours). The segment outlined in black represents night-time, orange represents day-time). Each tow is represented by a pair of symbols – in yellow the percentage of fish between the sea surface and 400m depth; in blue the percentage between 400m and 800m. The percentage value is indicated by the radial distance from the centre of each plot. Hence, if all fish in a tow were caught between the surface and 400m then the yellow symbol would be located on the outer edge of the plot and the corresponding blue symbol at the centre. We can see that in all the daytime tows in spring and summer the blue symbols are around the periphery – i.e. the majority of fish were located deeper than 400m. There were no day-time tows in the winter surveys. During night-time in spring and summer, the yellow symbols are closer the periphery than the blue symbols indicating that the fish were more aggregated in the surface – 400m layer. In the winter there was no clear pattern of night-time vertical distributions.
Our next step is to run our game theory model over an annual cycle with driving data inputs representing the Irminger Sea taken from the NEMO-MEDUSA global ocean geochemistry model. Based on these re-discovered data, if our model is correct, we expect the model to show that diel vertical migration is an evolutionary advantageous strategy only in the summer in the Irminger Sea. Watch this space!
References
Heath, M.R., Rasmussen, J., Ahmed, Y., Allen, J., Anderson, C., Brierley, A.S., Brown, L., Bunker, A., Cook, K., Davidson, R., Fielding, S., Gurney, W.S.C., Harris, R., Hay, S., Henson, S., Hirst, A.G., Holliday, P.N., Ingvarsdottir, A., Irigoien, X., Lindique, P., Mayor, D., Montagnes, D., Moffat, C., Pollard, R., Richards, S., Saunders, R.A., Sidey, J., Smerdon, G., Speirs, D., Walsham, P., Waniek, J., Webster, L. and Wilson, D. (2008). Spatial demography of Calanus finmarchicus in the Irminger Sea. Prog. Oceanogr. 76, 39-88. (http://dx.doi.org/10.1016/j.pocean.2007.10.001)
Pinti, J., DeVries, T., Norin, T., Serra-Pompei, C., Proud, R., Siegel, D.A., Kiørboe, T., Petrik, C.M., Andersen, K.H., Brierley, A.S. and Visser, A.W. (2023). Model estimates of metazoans’ contributions to the biological carbon pump. Biogeosciences 20, 997–1009. https://doi.org/10.5194/bg-20-997-2023
Leave A Comment
You must be logged in to post a comment.